A national housing-market research firm came to us with a business running on Microsoft Access and MySQL, all self-hosted, none of it talking to the rest. We rebuilt it as one web platform: seven internal applications behind a single login, plus a public research tool that subscribers pay for, all on the same data. It is in production, and nobody at the firm stopped working while we moved them.
Technology Stack: PHP · PostgreSQL · PostGIS · Python · nginx
Architecture: Centralized Web Application · Relational & Geospatial Data Platform · Unified Authentication · Subscription-Based Access Control
Deployment Status: Production
The client asked us not to name them. Everything below is described by industry, technology and scope.
The firm sends analysts out to survey apartment properties, draws a market area around a proposed site, and writes the studies that lenders and housing agencies rely on. For thirty years that work piled up in whatever tool was handy at the time. Field surveys, job tracking, senior-housing research and the management reports all lived in Access databases over MySQL, running on servers in the firm’s own office. Each one had its own tables, its own logins and its own version of the truth.
Around them sat a WordPress site, a mapping site built almost twenty years ago on another MySQL database, a lot of spreadsheets, and 172 GB of property photos. A property surveyed in one system had to be typed again into the next. A market area drawn on the map could not see the survey behind it. Some reports only ran on the one desktop that still had the right version of Access.
All of it worked, and all of it made money. But every server, database and website was the firm’s own to keep alive, and the whole business depended on it.
Systems that talk. One platform.
Tie the separate databases together into one platform, and move that platform onto systems we can support for the next twenty years: PostgreSQL and PostGIS for the data, Python for the processing, one PHP web application in front. And do it without interrupting the work that pays the bills. That gave us six rules:
We built one web application over one data layer. PostgreSQL and PostGIS hold the relational and geospatial data. PHP is the application layer behind nginx. Python does the data processing and the automation. Every legacy source was migrated into that layer, and each application was rebuilt on top of it while its Access predecessor stayed in service.
Here is the platform the way the firm’s staff and subscribers see it.
Type in an address and you get the surveyed apartment properties around it on a map, with demographics by census tract or ZIP code. Subscribers can open any property and see the whole survey: rents by floor plan, unit mix, square footage, amenities, utilities, year built and renovated, photos. They can draw a radius or a polygon and analyse the market inside it. Access is tiered, and a company subscribes once for everyone on its e-mail domain.
We had it in production about ten weeks after we started planning it. Subscriptions, live public demos and the capture-rate calculator followed over the next eight.
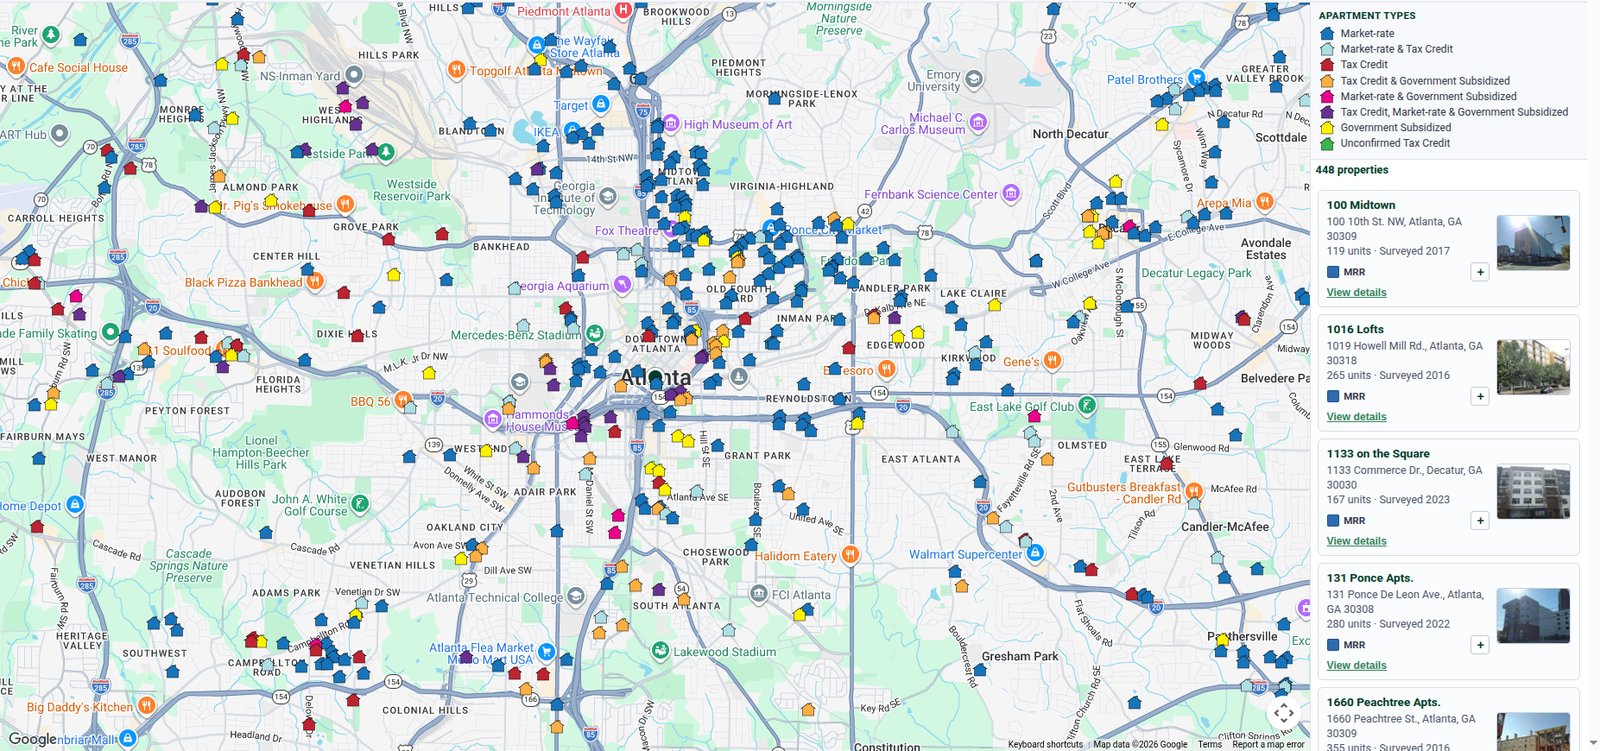
Search an address and every surveyed property nearby appears, coloured by program type, with the list alongside.
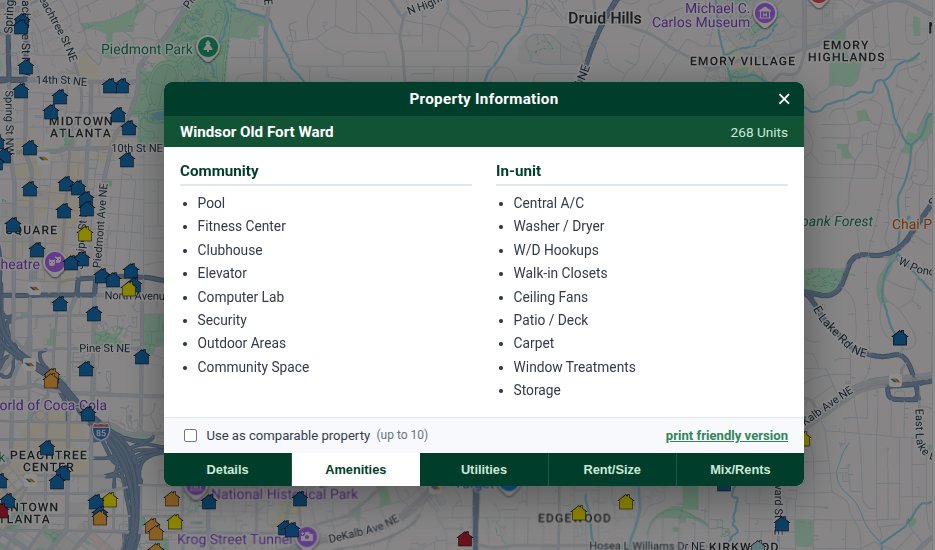
One click opens the full survey: details, amenities, utilities, rents by floor plan and unit mix.
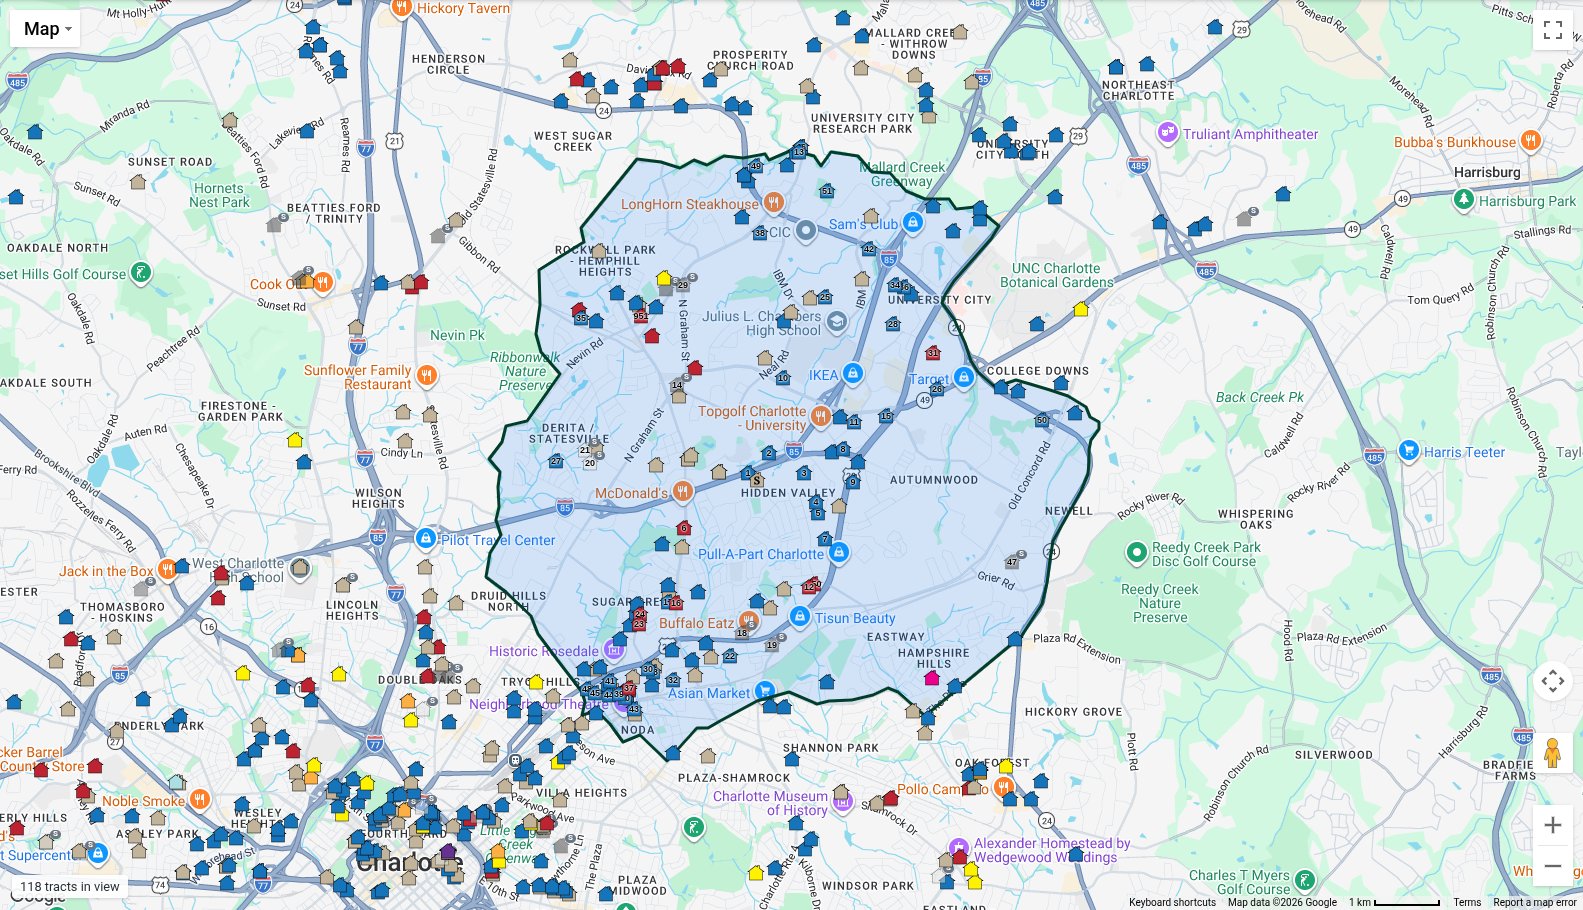
An analyst draws the market area. Every surveyed property inside the line is pulled into the study.
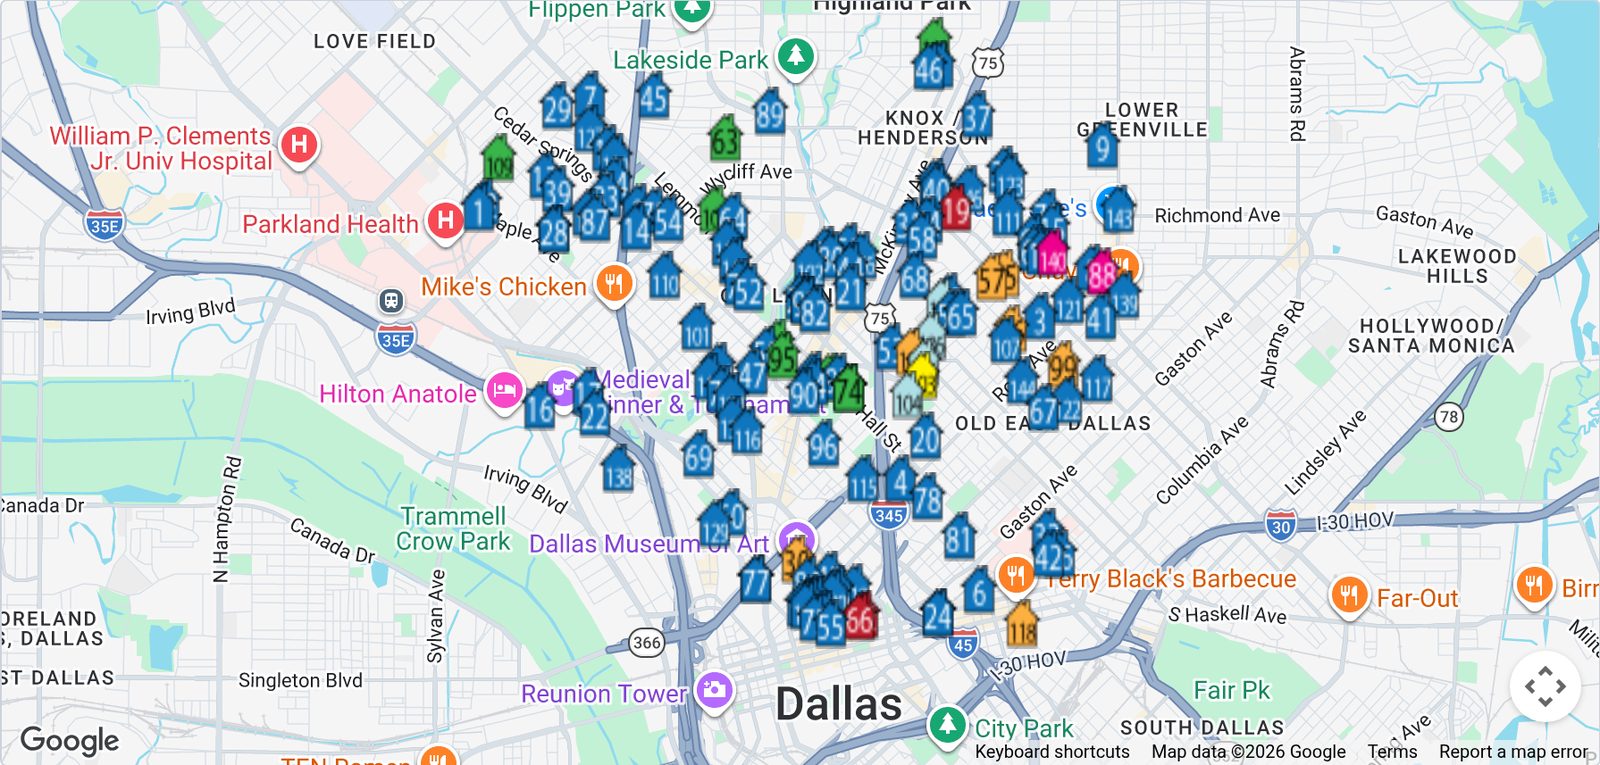
The report’s cover map: the same properties, numbered to match the project listing.
Analysts define a market area by radius or by drawing a boundary on the map. The platform picks up every surveyed property inside it, works out which census tracts it touches, and builds a 26-page apartment report: the project listing, units by project type and quality rating, units and sizes by bedroom count, year built and renovated, appliances and amenities, and a profile of each property. The report comes straight from the survey database. Once cached, it renders in 38 milliseconds.
Capture rate is the first number a lender, an agency or an investor asks for: how much of the income-qualified demand in a market does this project need to capture? The calculator takes the proposed unit count, market type, target income band and rent, pulls the HUD income limits for the county and the household demand for every tract in the drawn area, and returns the rate with the arithmetic shown. Analysts can click tracts on the map to include or exclude them, and the number updates as they go.
We ported the formula from the firm’s twenty-year-old JavaScript tool and checked the two against each other. Along the way we found two interpolation errors in the original. We fixed them in the rewrite rather than carrying them forward.
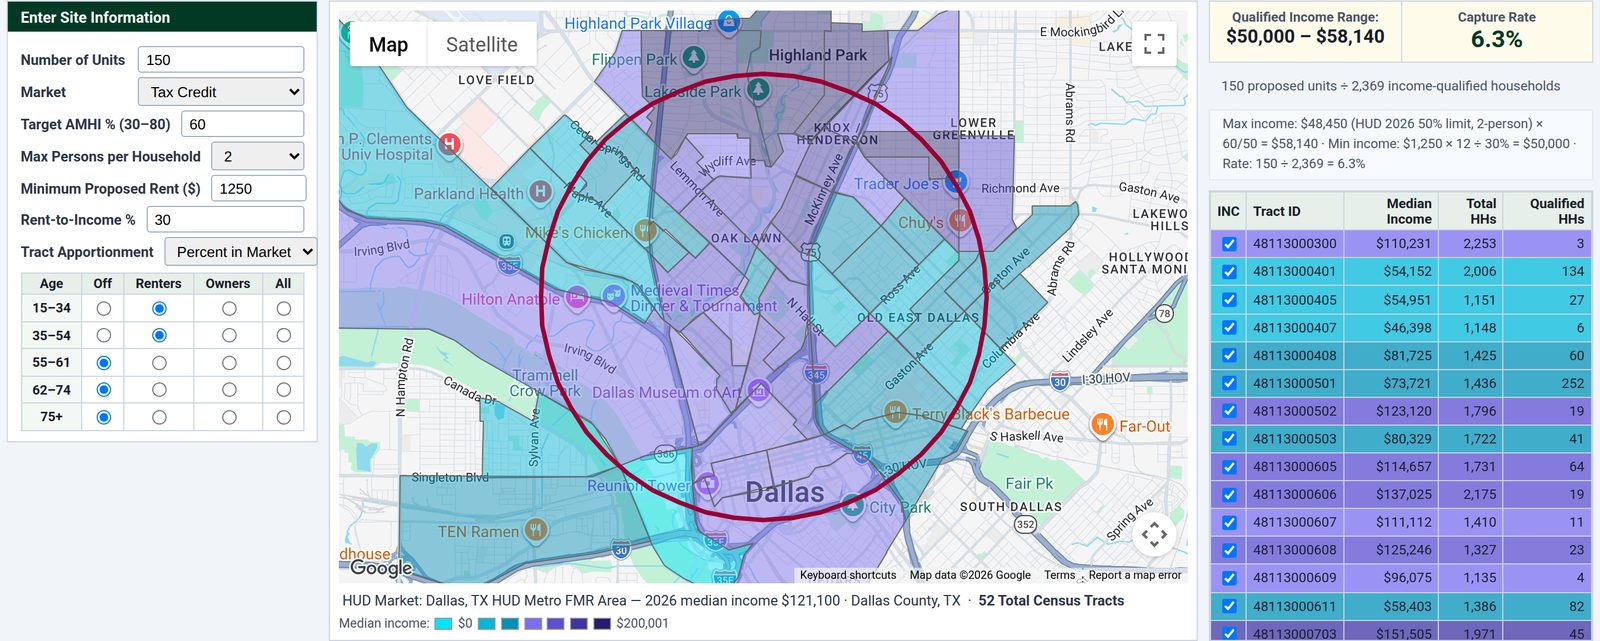
Site inputs, income by census tract, and the qualified-income and capture-rate readout.
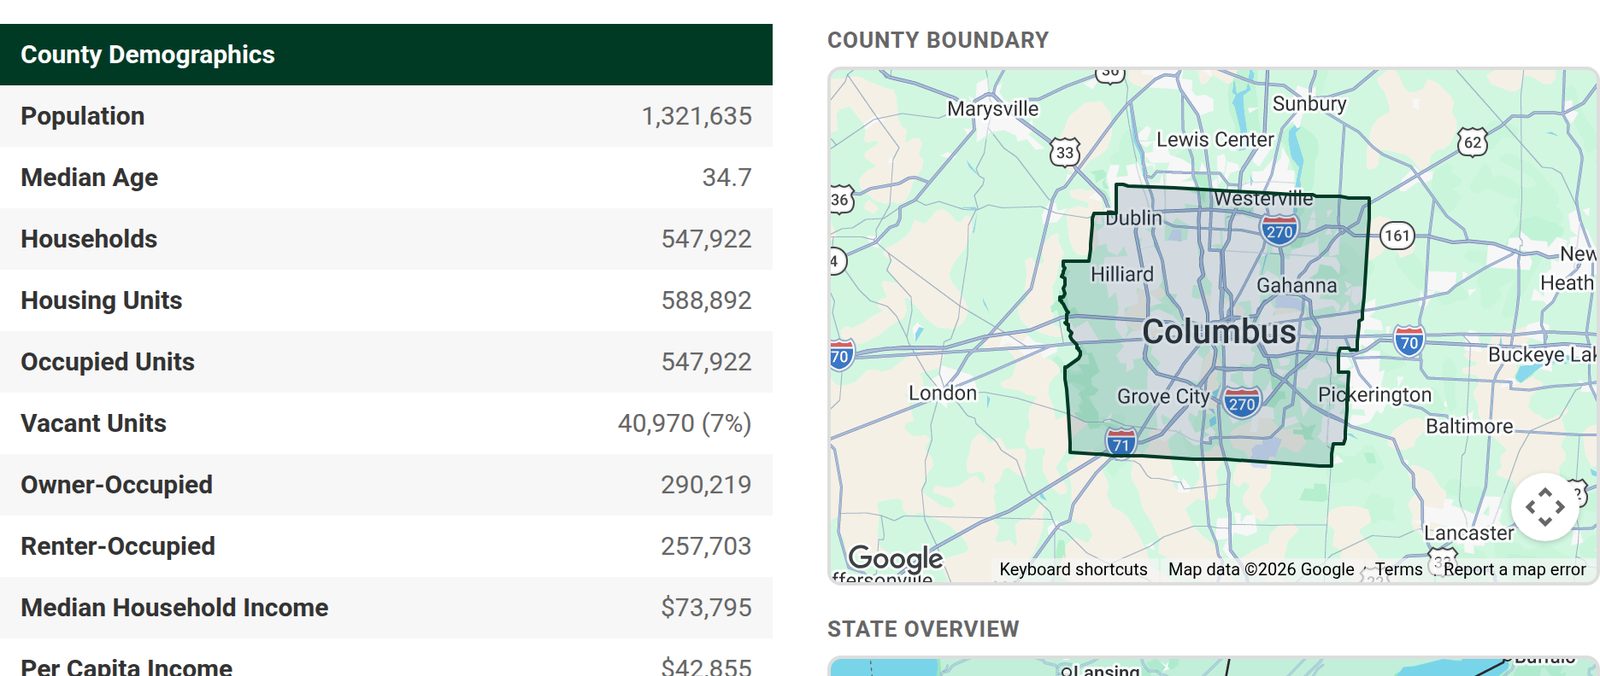
County demographics, with the county boundary drawn from PostGIS.
The platform carries HUD income limits and fair-market rents by county and year, about 3.6 million employment rows from the Bureau of Labor Statistics, Census demographics, and OMB metro definitions. It also holds utility-allowance schedules pulled from 399 housing-authority PDF documents across 49 states. We used AI to extract those, and a person approves every record before it is imported.
A public county lookup serves the demographics and HUD limits directly. A background worker builds the economic chapter of every study from the same series, in the firm’s own macro-enabled Excel and Word formats.
This is where the Access databases lived, and where the analysts spend most of their day. We rebuilt the field-survey data-entry sheets from the original Access report layouts, keyboard first, so nobody had to relearn their job. Every study now moves through a nine-step lifecycle from intake to payment. Documents generate straight into SharePoint. Payments post against an audit trail that can only be added to, never edited. The 58 management reports that used to live in Access became 18 web reports.
Three Access systems were moved this way while the desktop versions stayed in daily use. The desktop clients that remain connect through accounts that can only touch what they need. There were no downtime cutovers. A senior-housing survey database came across too, with all 216,000 rows of its audit history.
A platform this size breaks in small ways every week. What matters is what happens next. Every application on the platform reports into one ticket queue. The site files a ticket on its own when a page crashes. Background services file their own when a job fails. Any staff member can file one from a Submit Bug Report button on their account page, with the job number, what they were doing, how badly it is blocking them, and a screenshot. Duplicates fold into the open ticket instead of piling up.
Speed. A new ticket e-mails the engineering team the moment it lands, with a link straight to it. In its first month the queue took in several dozen tickets, some caught by the site itself, some from background services, the rest filed by staff. Most of the ones staff filed were fixed the same day, and a few were closed within the hour.
Accountability. Nothing closes without a cause. Every resolution is tagged as a code bug, a data problem, a configuration change, a third-party outage or user error, and it records who fixed it and when. So the team can see where its problems actually come from, not just that they got handled. Each update e-mails the person who reported it, in plain language, with no stack traces. And if a problem comes back after we called it fixed, it opens a new ticket rather than quietly reopening the old one. A fix that did not hold is visible to everyone.
Apartment inventory. 148,045 properties and 13.2 million apartment units across the country, with 653,655 field-survey records and 2.2 million floor-plan records gathered since the 1990s and still growing. The public view covers about 125,000 properties on a 30-day embargo, and 85% of them have photographs.
Geography. Every census tract in the country (85,146), 3,141 counties and 30,203 ZIP codes as live PostGIS geometry; 10,963 saved market-area polygons; 26 purchased demographic themes at tract and ZIP level, refreshed every year.
Government series. HUD limits and rents by county and year, 3.6 million BLS employment rows from 2001 to 2024, OMB delineations, and utility allowances from 399 housing-authority documents.
Measured against the goal: one platform, no disruption, and a research product the firm now sells.
Seven internal applications and the public research tool behind one sign-in.
Three Access systems migrated while the desktop applications stayed in daily use.
Public research tool from first plan to production. Subscriptions and the capture-rate engine within eight more.
Access reports consolidated into audited web reports, guarded by a 174-check regression harness and 24 financial-math unit tests.
A full apartment report over a two-mile market, cold versus cached, behind rate limiting.
In six months, including a critical flaw in a legacy upload script found and fixed the same day.
A lot of this platform was built by a small team using AI coding tools, under our own engineering rules. Every module has to pass the same three tests before we call it done:
Decisions about money and legal exposure stay with people. AI makes a small team fast. The rules are what make it dependable.
Talk to one of our engineers about what a platform like this would look like for your business.